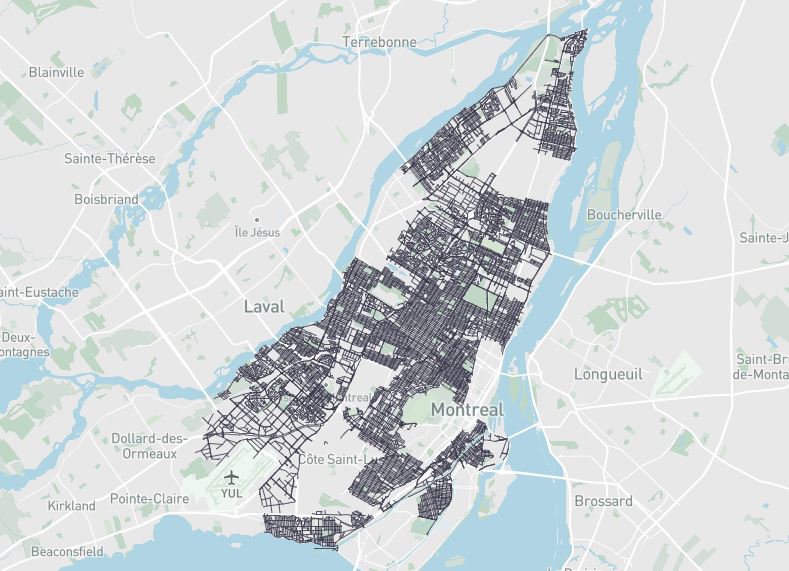
Traffic danger isn’t just about crashes—it’s about where people feel unsafe, where they avoid walking, and where poor street design threatens lives. The combination of traffic hazard (the level of potential harm) with exposure (the number of people using the space) is what results in different levels of crash severity. Developed through a robust Multi-Criteria Decision Aiding (MCDA) approach, the Traffic Hazard Tool provides a validated, data-driven way to measure and map traffic hazard across both street segments and intersections (example application in Montreal) in Montreal. This tool empowers planners, researchers, and the public to take a proactive approach to street safety with transparency and evidence rather than waiting for crashes before deciding /acknowledging that something is dangerous.
Developed through consultation with transportation engineers, urban planners, public health professionals, parents, children and community members
Visual and Actionable
Hazard scores are mapped in an intuitive GIS platform, making results easy to interpret and use
Validated by Experts
Achieved over 90% alignment with expert rankings during the validation process.
Transparent and Reproducible
Built using a fully documented MCDA process. All criteria, weights, and decision logic are accessible and adaptable.
Comprehensive Data Inputs
Uses traffic and design characteristics , presence of heavy vehicle , Land use , Pedestrian visibility, and behavioral indicators.
Context-Ready
The tool is adaptable to other cities—just update the data and adjust weights if needed.
What Makes It Unique?
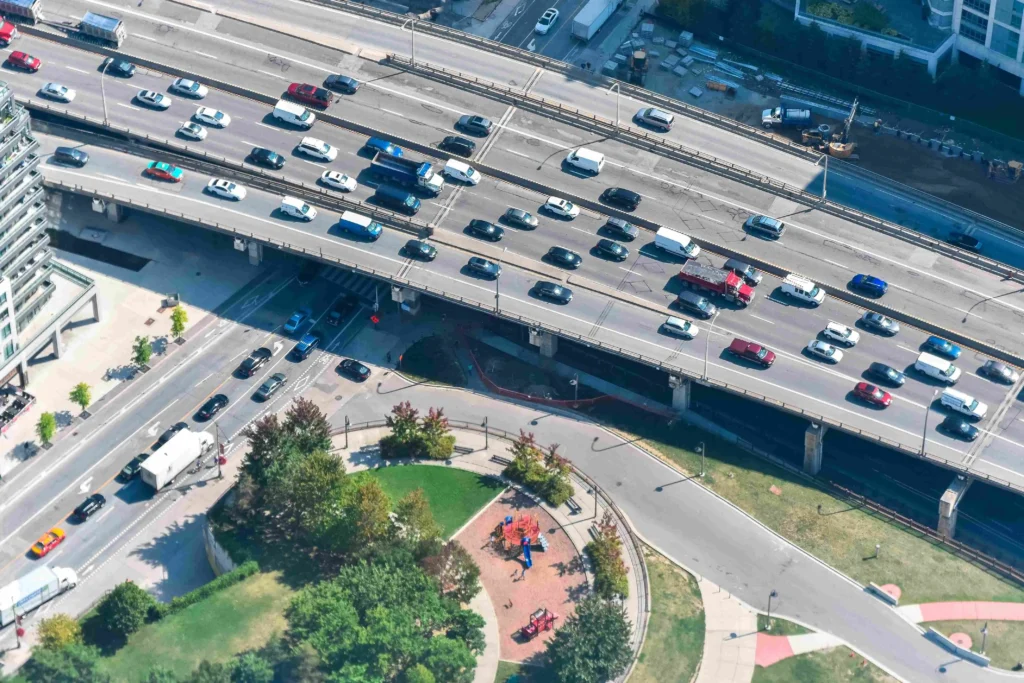
The Hidden Hazard
The Traffic Hazard Tool is a decision-support application that identifies, evaluates, and visualizes traffic danger at both street and intersection levels in urban areas. It is built through a two-part MCDA model using the MACBETH method, combining expert and community input with GIS spatial analysis to calculate hazard scores.
Who It’s For:
Community members
NGOs and advocacy groups
Researchers
Urban planners and engineers
Policymakers
Methodology
Structuring
The Traffic Hazard Tool is based on a two-part MCDA framework:
Street Segment-Level Hazard Model:
Assesses street segments based on six criteria:
Traffic-design characteristics
Number of heavy vehicles
Traffic calming measures
Land use
Drivers’ visibility
Drivers’ behavior
Intersection-Level Hazard Model:
Evaluates different intersections using seven criteria:
Hazard level of connecting street segments
Geometric design of intersections
Traffic control
Pedestrian visibility
Traffic calming
Land use and Commercial size
Bike path design
Evaluation
Construction of performance level for each criteria
Weighting criteria
Validation
Each model was developed using the MACBETH MCDA method, with contributions from experts in transportation, public health, and urban design. Scores are validated and visualized through the GIS platform.
Explore the Maps
Interactive Hazard Map for selected neighborhood at City of Montreal
Adding Filter by hazard level, borough, or street type